Lecture 4 - (10/02/2026)
Today’s Topics:
Marks and Channels
Temporal Data
Marks and Channels
Altair recgonizes 4 different variable types:
Nominal (Categorical)
Quantative
Ordinal
Time-Based
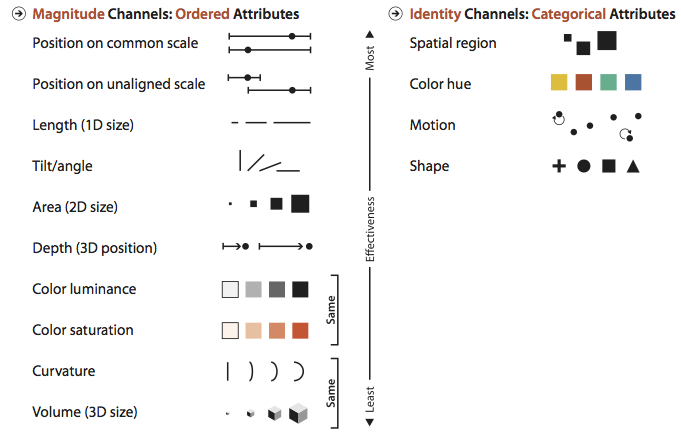
Magnitude channels requires an ordered variable (Quantative/Ordinal)
Identity channels require a categorical attribute (Nominal)
# if necessary
!pip install altair vega_datasets
import altair as alt
from vega_datasets import data
import pandas as pd
from altair import datum
url = 'https://vega.github.io/vega-datasets/data/penguins.json'
data = pd.read_json(url)
data['index'] = data.index
data.head()alt.Chart(data)---------------------------------------------------------------------------
SchemaValidationError Traceback (most recent call last)
File ~/Documents/data-visualization-sp26/.venv/lib/python3.13/site-packages/altair/vegalite/v6/api.py:4173, in Chart.to_dict(self, validate, format, ignore, context)
4171 copy.data = core.InlineData(values=[{}])
4172 return super(Chart, copy).to_dict(**kwds)
-> 4173 return super().to_dict(**kwds)
File ~/Documents/data-visualization-sp26/.venv/lib/python3.13/site-packages/altair/vegalite/v6/api.py:2121, in TopLevelMixin.to_dict(self, validate, format, ignore, context)
2118 # remaining to_dict calls are not at top level
2119 context["top_level"] = False
-> 2121 vegalite_spec: Any = _top_schema_base(super(TopLevelMixin, copy)).to_dict(
2122 validate=validate, ignore=ignore, context=dict(context, pre_transform=False)
2123 )
2125 # TODO: following entries are added after validation. Should they be validated?
2126 if is_top_level:
2127 # since this is top-level we add $schema if it's missing
File ~/Documents/data-visualization-sp26/.venv/lib/python3.13/site-packages/altair/utils/schemapi.py:1238, in SchemaBase.to_dict(self, validate, ignore, context)
1236 self.validate(result)
1237 except jsonschema.ValidationError as err:
-> 1238 raise SchemaValidationError(self, err) from None
1239 return result
SchemaValidationError: '{'data': {'name': 'data-c46e1ab98ba3fb2ca8b5ae3c04ffafea'}}' is an invalid value.
'mark' is a required propertyalt.Chart(...)Notice how we cannot create a chart unless we specify the required mark
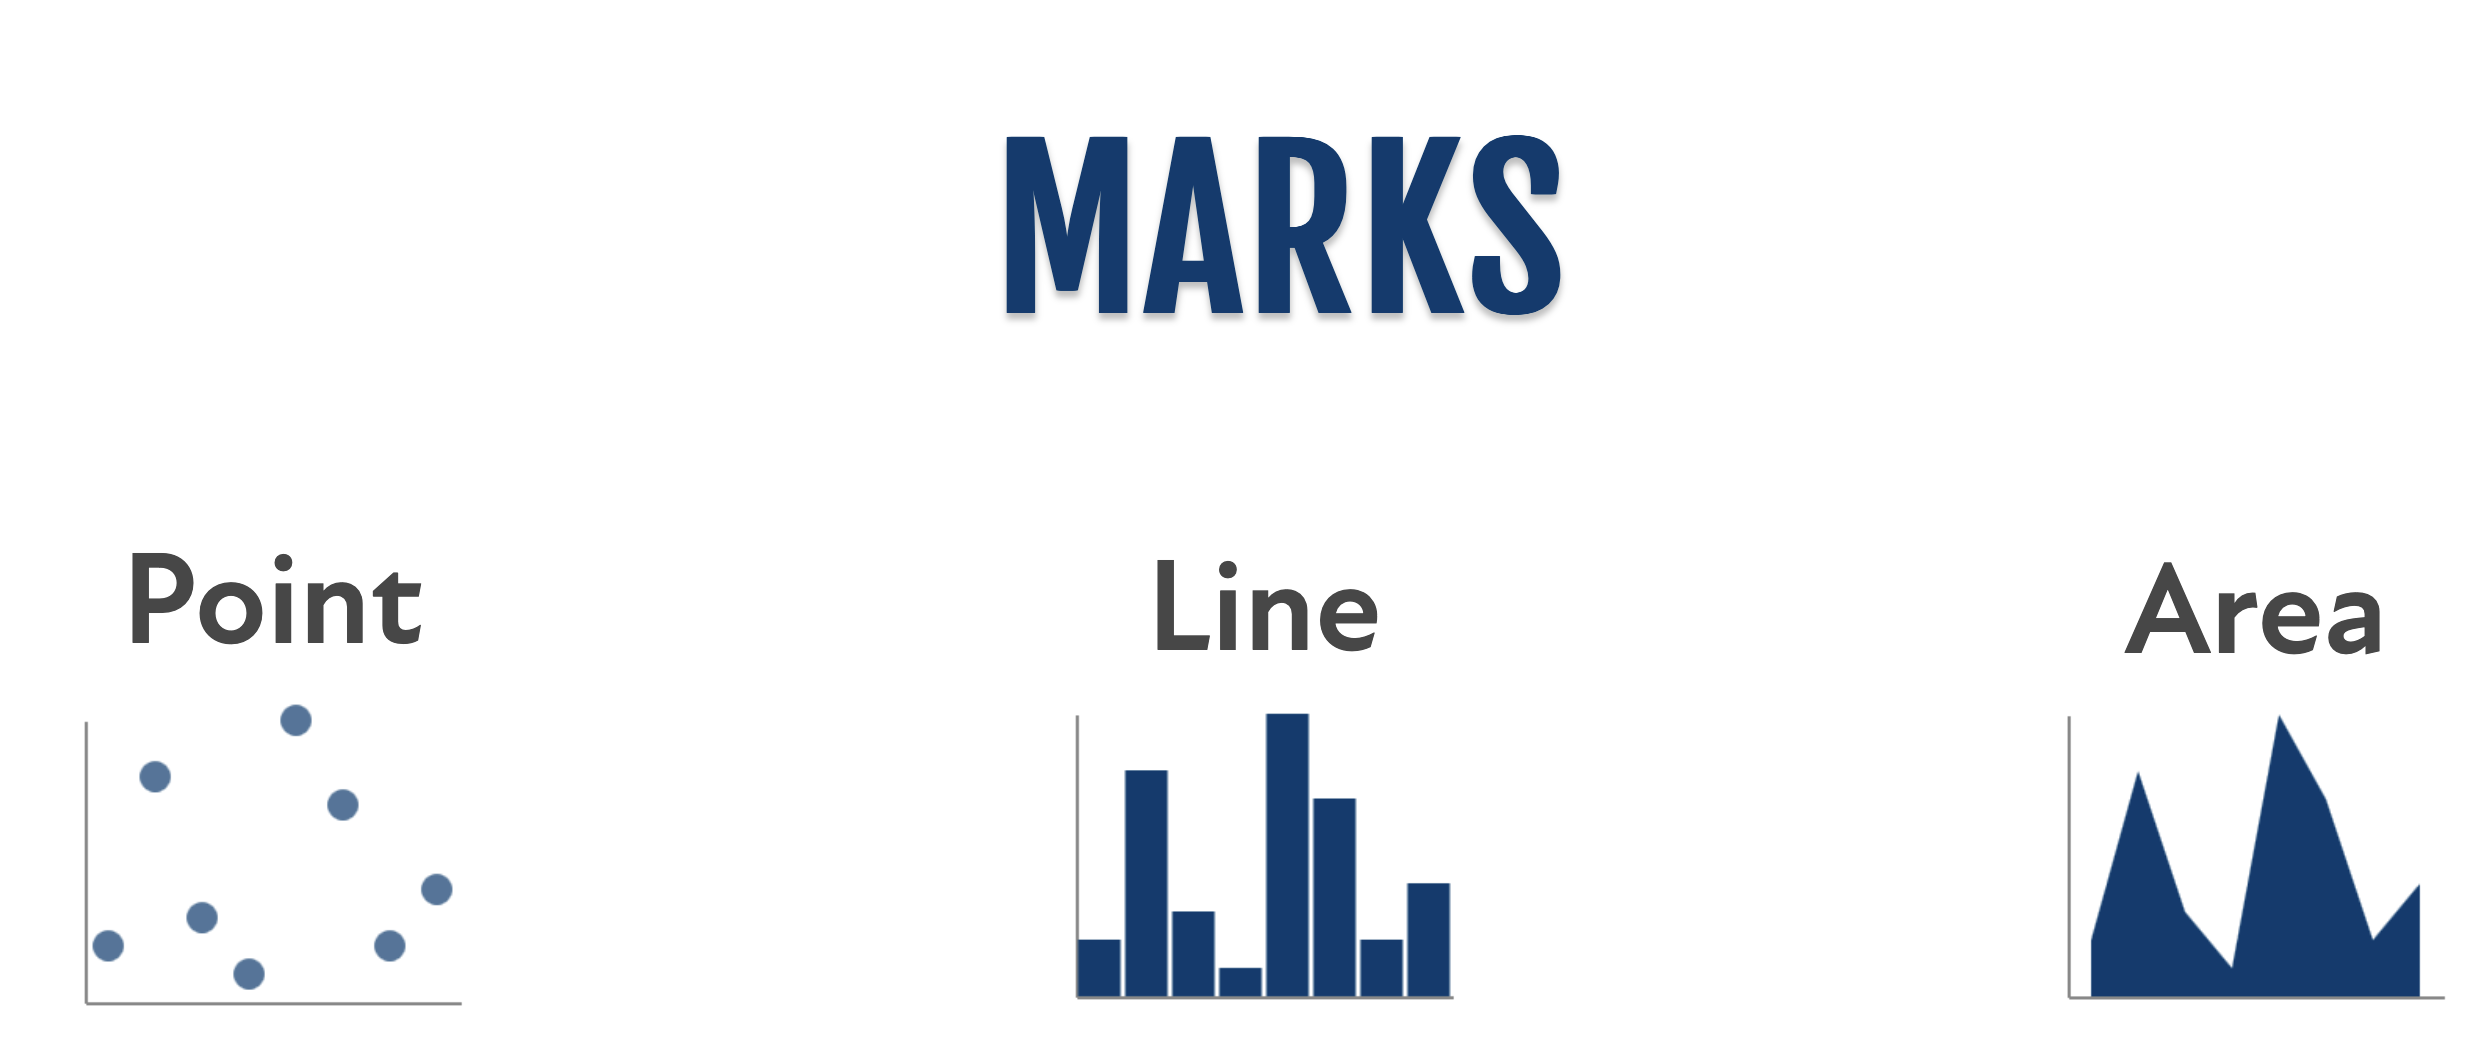
alt.Chart(data).mark_circle()List of all marks in altair
altair
Notice how the marks in altair are the same ones used in vega
https://
Often times you’ll want to use vega-lite documentation since it’s the underlying language for our visualizations
alt.Chart(data).mark_circle().encode(
    x='Beak Length (mm):Q'
)or equivilantly
alt.Chart(data).mark_circle().encode(
    x=alt.X('Beak Length (mm):Q')
)and if we want to change the zero
alt.Chart(data).mark_circle().encode(
    x=alt.X('Beak Length (mm):Q', scale=alt.Scale(zero=False))
)next we can split the data into multiple graphs by columns
Columns
alt.Chart(data).mark_circle().encode(
    x=alt.X('Beak Length (mm):Q', scale=alt.Scale(zero=False)),
    column='Species'  # notice how it automatically determines we're working with
)Transformations
Let’s try bar plotting the first 20 beak lengths
alt.Chart(data[:20]).mark_bar().encode(
    x='Beak Length (mm):Q',
    y='index:O'
)Notice how we did this using pandas, but we can also do this using altair
alt.Chart(data).mark_bar().encode(
    x='Beak Length (mm):Q',
    y='index:O'
).transform_filter(
    datum.index < 20
)alt.Chart(data).mark_bar().encode(
x='Beak Length (mm):Q',
y='index:O'
).transform_filter(
(datum.index < 60) & (datum.Island == 'Biscoe')
)First 60 values where their island was Biscoe
Properties
alt.Chart(data).mark_bar().encode(
    x='Beak Length (mm):Q',
    y='index:O'
).transform_filter(
    (datum.index  < 60) & (datum.Island == 'Biscoe')
).properties(height=200, width=700)alt.Chart(data).mark_circle().encode(
x=alt.X('Beak Length (mm):Q', scale=alt.Scale(zero=False)),
color='Species',
size='Beak Length (mm):Q'
).properties(height=200, width=700)Color Luminance
alt.Chart(data).mark_circle().encode(
    x=alt.X('Beak Length (mm):Q', scale=alt.Scale(zero=False)),
    color=alt.Color('Beak Length (mm):Q', scale=alt.Scale(scheme='greys')),
    size='Beak Length (mm):Q'
).properties(height=200, width=700)alt.Chart(data).mark_circle().encode(
x=alt.X('Beak Length (mm):Q', scale=alt.Scale(zero=False)),
color=alt.Color('Beak Length (mm):Q', scale=alt.Scale(scheme='purples')),
size='Beak Length (mm):Q'
).properties(height=200, width=700)alt.Chart(data).mark_circle().encode(
y=alt.Y('Beak Length (mm):Q', scale=alt.Scale(zero=False)),
color=alt.Color('Beak Length (mm):Q', scale=alt.Scale(scheme='purples')),
size='Beak Length (mm):Q',
x=alt.X('Species')
).properties(height=200, width=700)alt.Chart(data).mark_circle().encode(
y=alt.Y('Beak Length (mm):Q', scale=alt.Scale(zero=False)),
color=alt.Color('Species:N', scale=alt.Scale(scheme='category10')),
size='Beak Length (mm):Q',
x=alt.X('Species')
).properties(height=200, width=700)alt.Chart(data).mark_point().encode(
y=alt.Y('Beak Length (mm):Q', scale=alt.Scale(zero=False)),
shape='Species:N',
color=alt.Color('Species:N', scale=alt.Scale(scheme='category10')),
size='Beak Length (mm):Q',
x=alt.X('Species:N')
).properties(height=200, width=700)Expressiveness:
Visual encoding should express all of—and only—the information in the dataset.
Ordered data should be shown in a way we perceive as ordered.
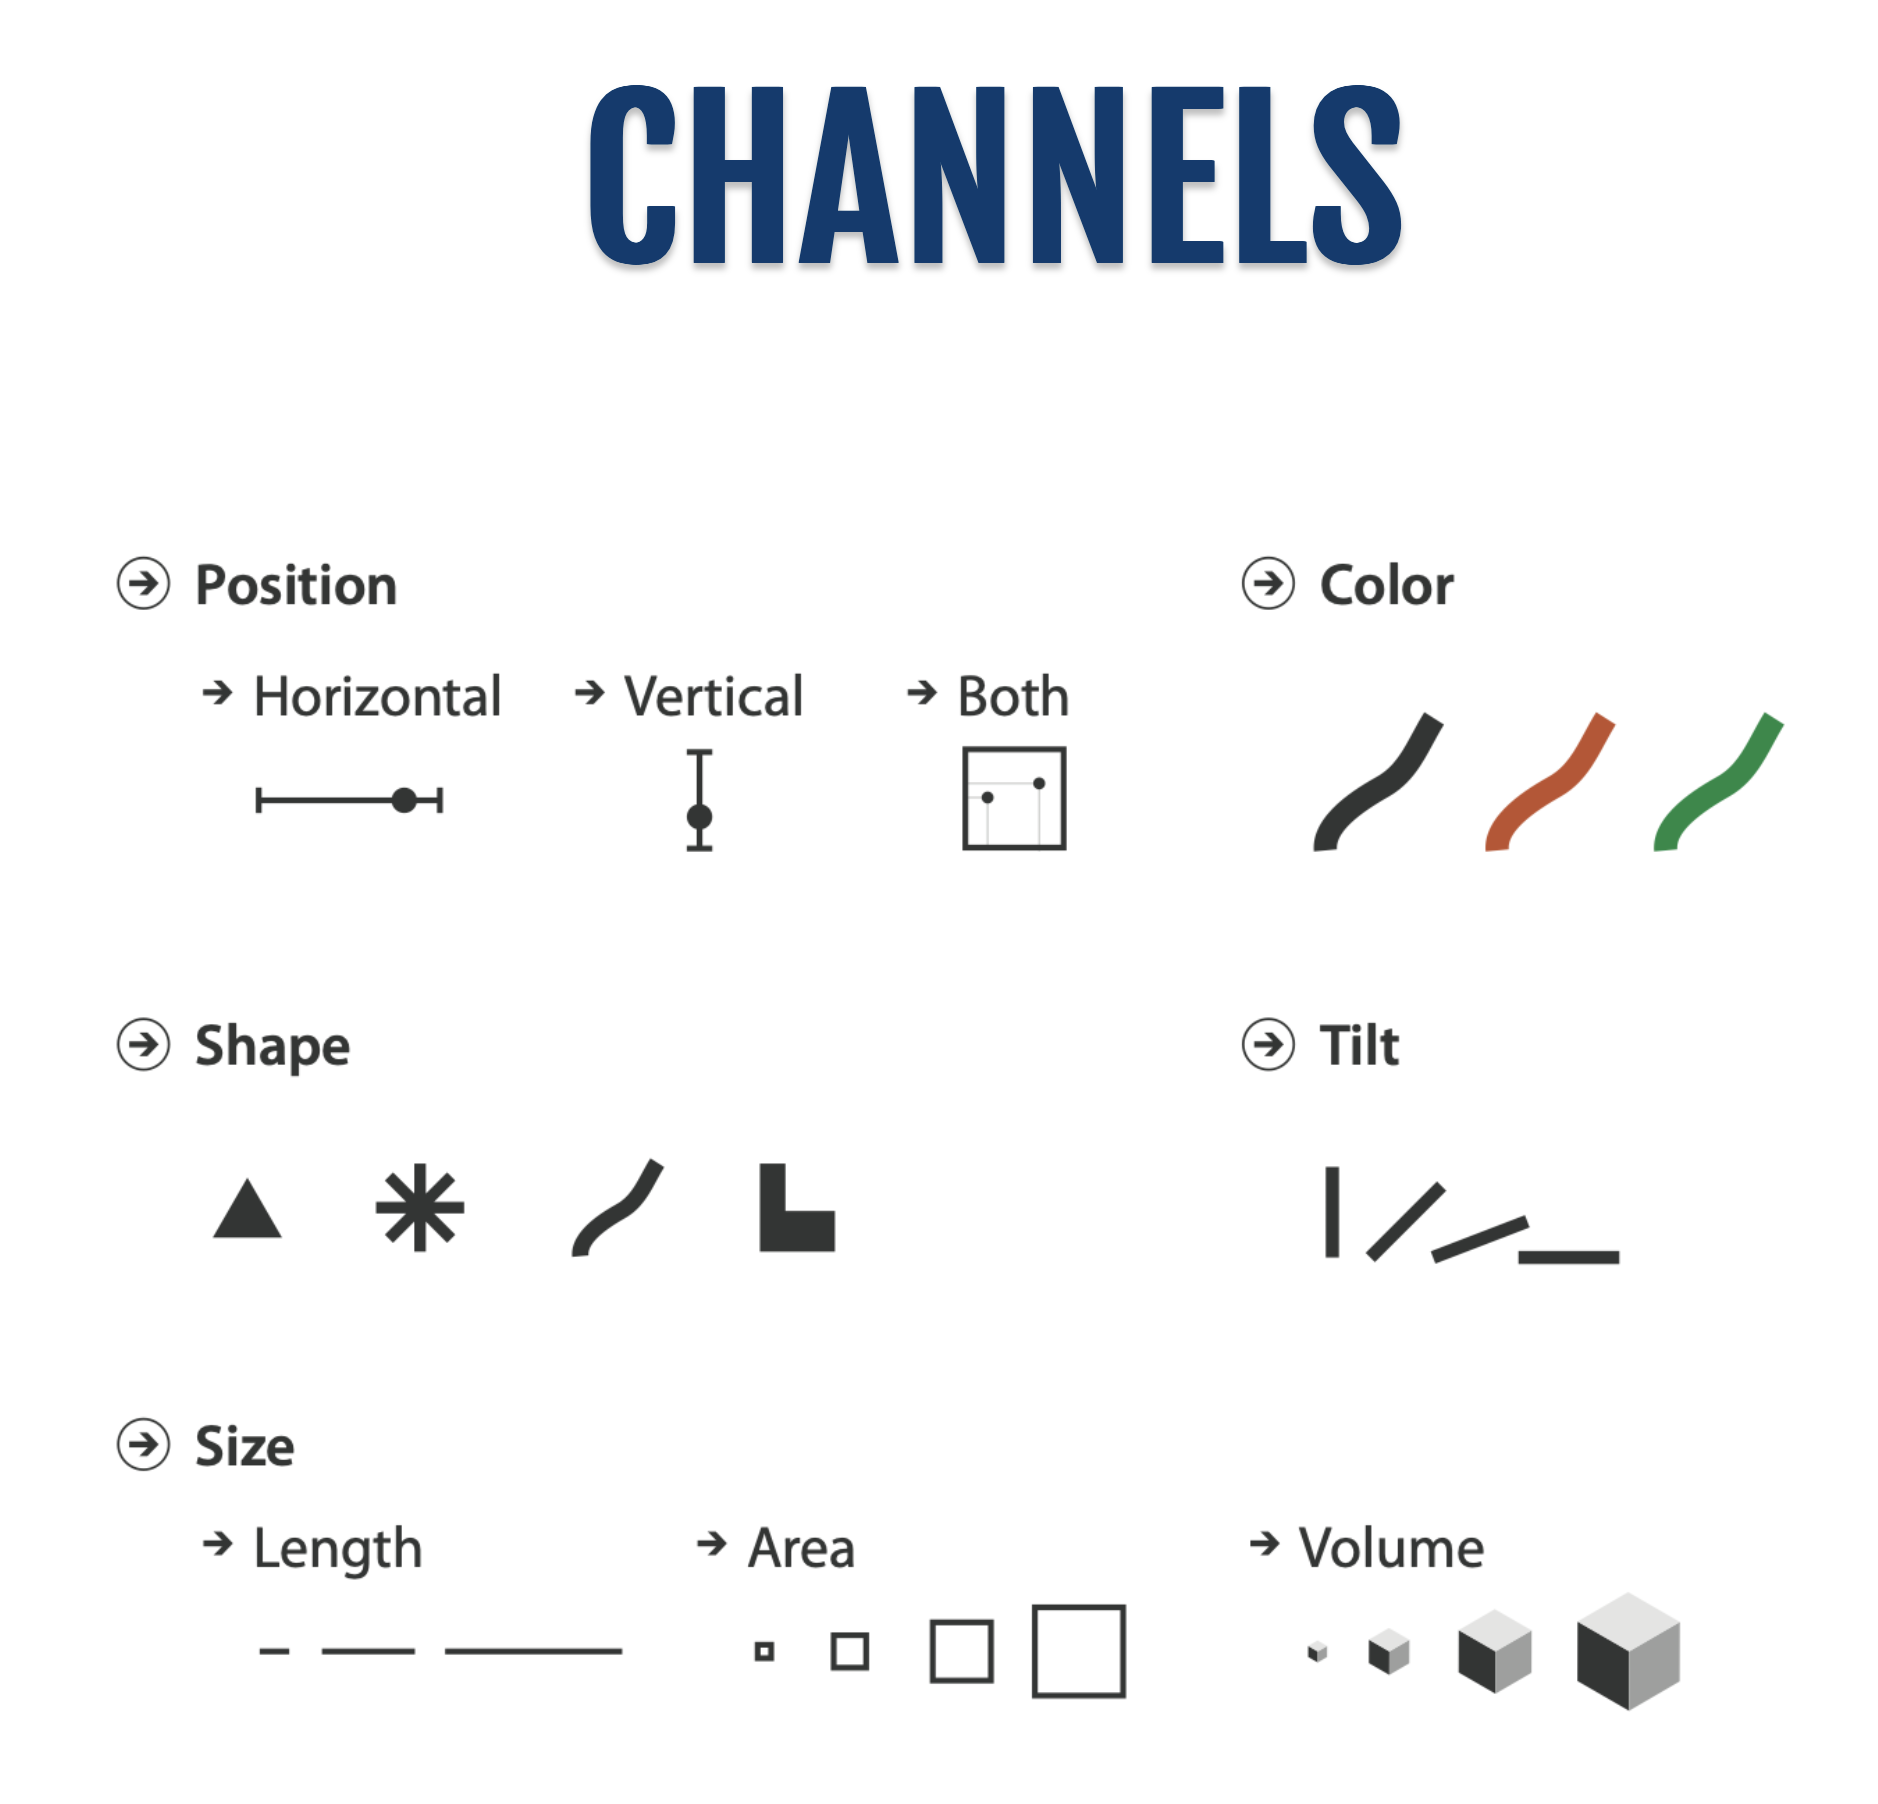
Match channel and data characteristics.
Effectiveness:
Encode most important attributes with highest-ranked channels
Temporal Data
A temporal dataset is one where each attribute has a timestamp
Sometimes is cyclic due to seasonality
Line chart / Dot plot:
Idea: One key, one value
Data: Two quantitative attributes
Mark: Points and Line connection marks between them
Channels
Aligned lengths to express quant value
Seperated and ordered by key attribute into horizontal regions
Task: Find trend
Connection marks emphasize ordering of items along key axis by explicitly showing relationship between one item and the next
Scalability: hundreds of key levels, hundreds of value levels
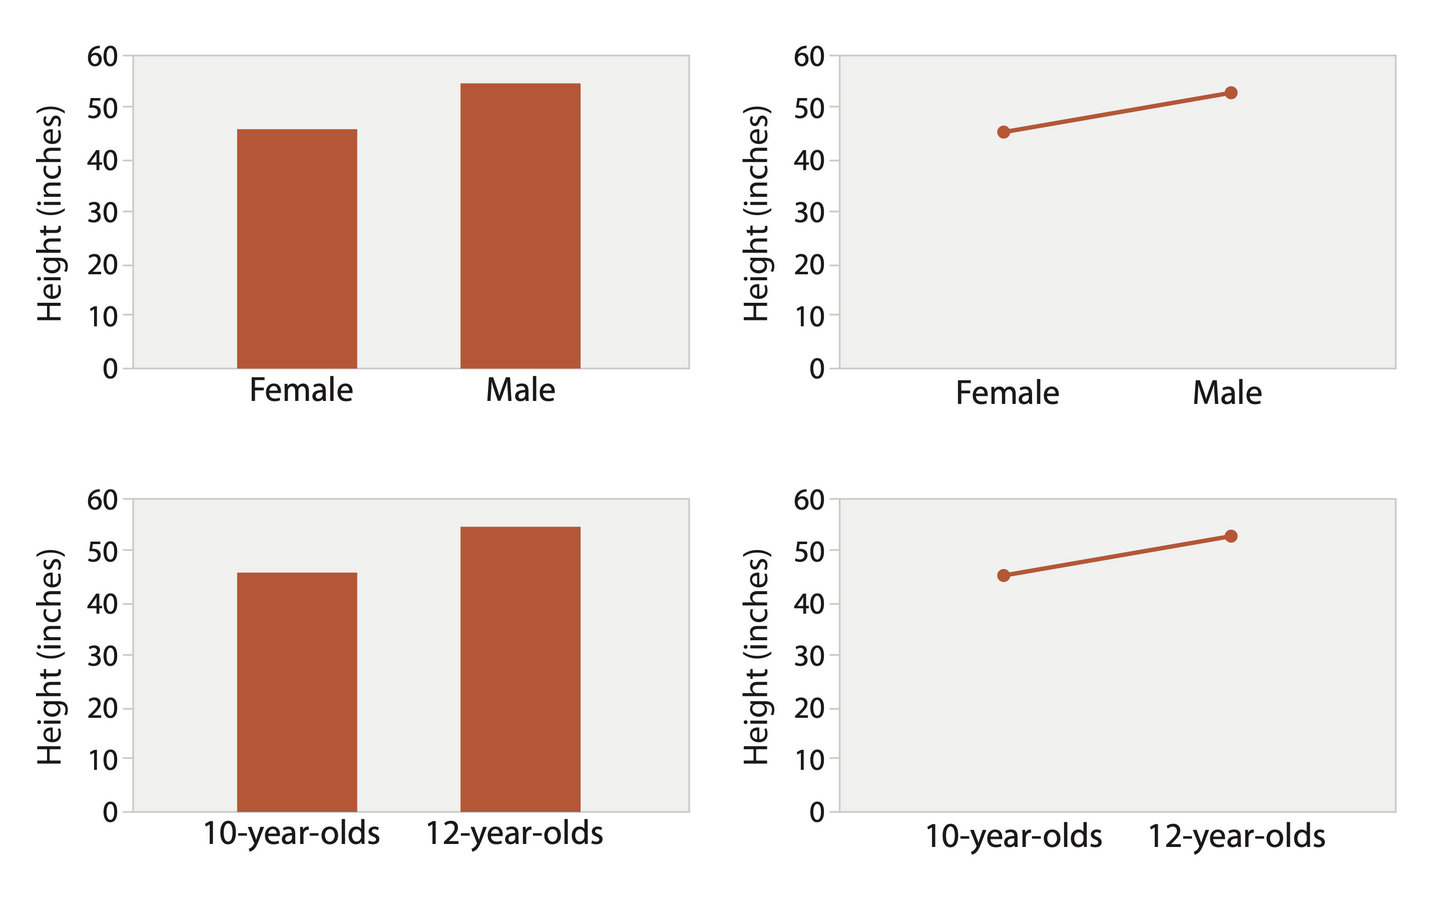
Bar vs Line
Depends on the key attribute:
Bar charts if categorical
Line charts if ordered
Do not use line charts for categorical key attributes!!!
Violates expressiveness principle
Implication of trend so strong that it overrides semantics!
ex: The more male a person is, the taller he/she is
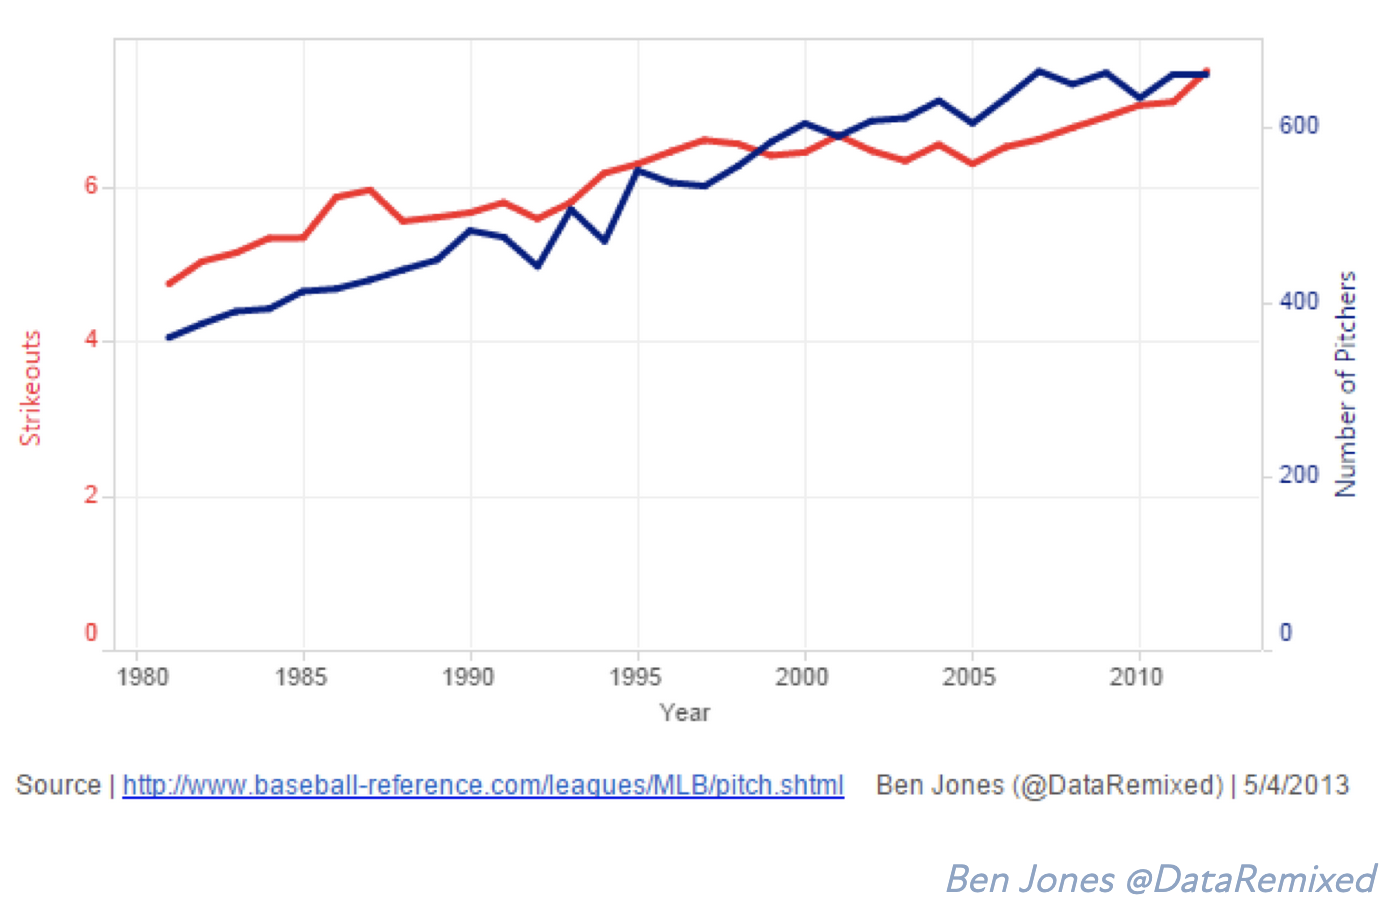
Note: Dual-Axis Line Charts
Controversial
Acceptable if commensurate
Beware, very easy to mislead!
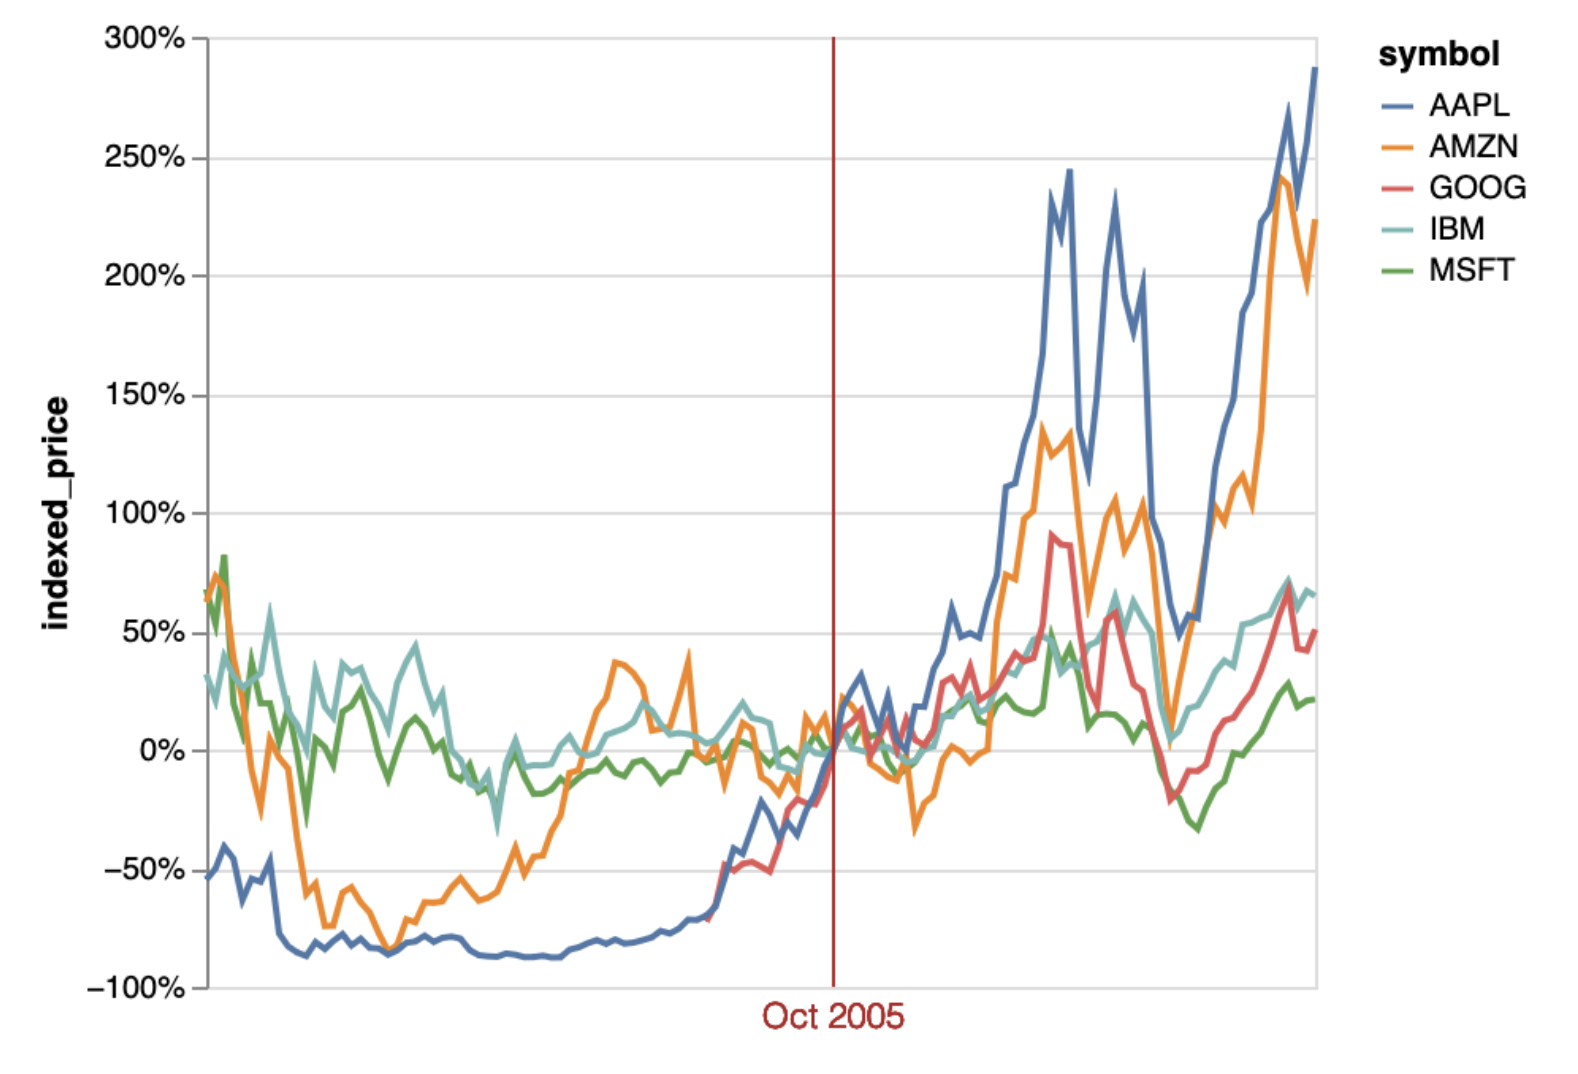
Note: Indexed Line Charts
Data: two quantitative attributes
One key and one value
Derived data: new quantitative value attribute
Index
Plot instead of original value
Task: show change over time
df = px.data.stocks()
df.head()alt.Chart(df).mark_bar().encode(
x='date:T',
y='MSFT:Q'
)Good or Bad?
alt.Chart(df).mark_line().encode(
    x='date:T',
    y='MSFT:Q'
)Good or Bad?
We can convert between units of time using the built in functions
alt.Chart(df).mark_line().encode(
    x='yearmonth(date):T',
    y='MSFT:Q'
)alt.Chart(df).mark_bar().encode(
x='yearmonth(date):T',
y='MSFT:Q'
)These functions are called aggregation functions because they take a series of values and bin them together into one value
alt.Chart(df).mark_rect().encode(
    x='year(date):T',
    y='month(date):T',
    color='MSFT'
)But what if we want to plot multiple lines?
alt.Chart(df).transform_fold(
    ['GOOG', 'AAPL', 'AMZN', 'MSFT', 'FB'],
    as_=['stock', 'price']
).mark_line().encode(
    x='date:T',
    y='price:Q',
    color='stock:N'
)
The fold transform is, in short, a way to convert wide-form data to long-form data directly without any preprocessing. Fold transforms are the opposite of the Pivot.