Lecture 2 - (03/02/2026)
Today’s Topics:
Data Scope
Statistics Recap
Sampling Methods
Data Scope
How can we draw conclusions about large populations using small samples?
E.g., pollsters sample small numbers of voters to predict election results.
Famous polling failures:
Literary Digest predicted Roosevelt would lose in 1936 (based on sample of those with telephone & car registration)
Gallup Poll used quota sampling in 1948 and predicted Dewey winning.
How can we do better?
Generalizing from Data: Sampling Scenarios
Population: The set of all people
Sampling frame: The set of all possible units that can be drawn into a sample
Sample: a subset of the sampling frame
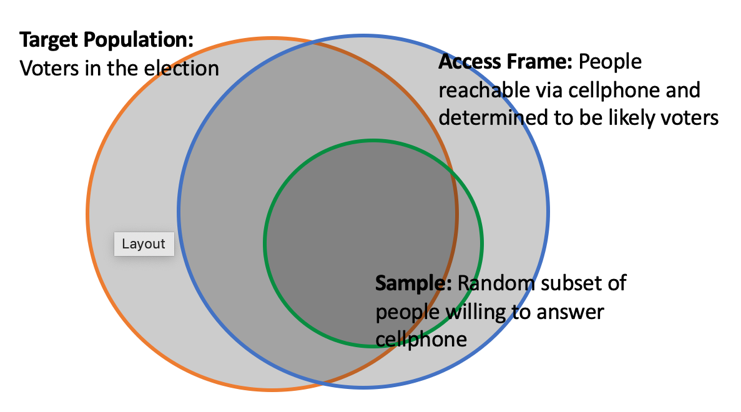
Bias
Coverage bias: access frame does not include everyone in the target population.
Ex: A phone survey cannot reach those without a phone.
Selection bias: certain items selected more than should.
Ex: a convenience sample chooses the units most easily available.
Non-response bias: unit and item. Unwilling to participate at all or for given item.
Measurement bias: happens when an instrument systematically misses the target in one direction.
Ex: low humidity can give us incorrectly high measurements of air pollution.
Variation
Variation is also called Precision in Computer Science fields (i.e. ML, AI, Numerical Methods)
Sampling variation: results from using chance to select a sample.
Can (often) compute the chance a particular elements is selected.
Assignment variation: occurs when we assign units at random to treatment groups.
Can (often) compute the chance of a particular group assignment.
Measurement error: for an instrument results from the measurement process.
Assuming no drift or bias, taking multiple measurements on the same object will give random variations that are centered on the truth.
Statistics Recap
Expectation and Variance
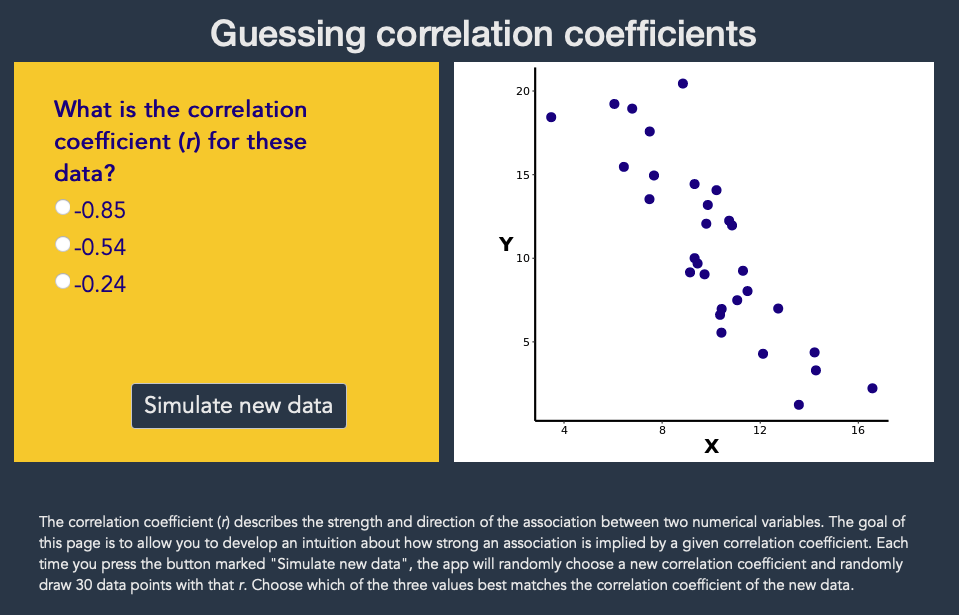
Correlation Coefficients
Roughly: measuring interdependence of two variables.
Pearson’s R Correlation Coefficient:
Ranges from 1 (positively correlated) to -1 (negatively correlated)
import pandas as pd
url = "https://raw.githubusercontent.com/mwaskom/seaborn-data/master/tips.csv"
df = pd.read_csv(url)

df[['total_bill', 'tip', 'size']].corr(numeric_only=True)This table is called the correlation matrix, the closer it is to 1, the more strongly variable x and y are related.
Correlation does not imply causation!!!
import numpy as np

n = 365
temperature = np.random.normal(75, 10, n)

# generate dummy data

ice_cream_sales = 200 + 3 * temperature + np.random.normal(0, 20, n)
crime_rate = 50 + 2 * temperature + np.random.normal(0, 15, n)

df = pd.DataFrame({
    "temperature": temperature,
    "ice_cream_sales": ice_cream_sales,
    "crime_rate": crime_rate
})

df[['ice_cream_sales', 'crime_rate']].corr()Claim: Higher ice cream sales cause more crime.
Reality:
Temperature is a confounding variable
Hot days -> more ice cream sales
Hot days -> more people outside -> more crime
Summary Statistics
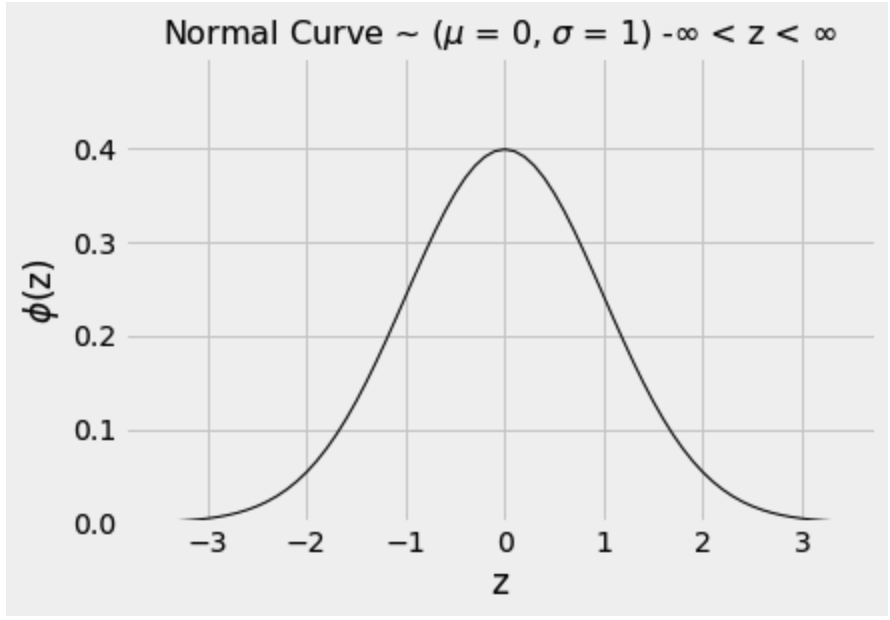
The curve is symmetric about 0 with its mean and median both 0.
Pandas: x.mean() and x.median()
If a variable has this distribution, its SD is 1.
Pandas: x.std()
Sampling methods
Generalising from Data: Cluster Sampling
Let’s suppose we have 8 individuals
population = [B1, B2, M1, Q1, Q2, Q3, Q4, S1]We can divide the population into clusters and then use SRS (simple random sampling) to select clusters at random.
Let’s make clusters of size 2 roughly by borough.
boro_b = [B1, B2]
island = [M1, S1]
queens1 = [Q1, Q2]
queens2 = [Q3, Q4]
Now, we sample uniformly from the clusters. There are 4 clusters and each has equal probability
import random
random.choice([boro_b, island, queens1, queens2])
Cluster sampling reduces cost by sampling an entire group
Generalising from Data: Stratified Sampling
A strata is a subgroup of a population that shares a common characteristic and is internally similar (in some way) but different from other groups
Stratified sampling divides the populartion into strata.
population = [B1, B2, M1, Q1, Q2, Q3, Q4, S1]queens = [Q1, Q2, Q3, Q4]
not_queens = [B1, B2, M1, S1]Now, we sample uniformly from the clusters using SRS. There are 4 choices for the first strata, and 4 for the second strata
Stratified sampling improves prevision by sampling from every subgroup