Assignment 1
CSci 39542: Introduction to Data Science
Department of Computer Science, Hunter College, City University of New York
Spring 2026
All students must join the course’s gradescope using the provided access code: PK36RW. Students must verify that their Gradescope account has their full name and CUNY email address in the account settings (Account > Edit Account).
Unless otherwise noted, programming assignments are submitted on the course’s Gradescope site and are written in Python. The autograders expect a .py file and do not accept iPython notebooks. Also, to receive full credit, the code should be compatible with Python 3.6 (the default for the Gradescope autograders) and written in good style.
To get full credit for a program, the file must include in the opening comment:
Your name, as it appears in your Gradescope registration.
The email you are using for Gradescope.
A list of any resources you used for the program. Include classmates and tutors that you worked with, along with any websites or tutorials that you used. If you used no resources (other than the class notes and textbooks), then you should include the line: “No resources used.”
For example, for the student, Thomas Hunter, the opening comment of his first program might be:
"""
Name:  Thomas Hunter
Email: thomas.hunter1870@hunter.cuny.edu
Resources:  Used python.org as a reminder of Python 3 print statements.
"""
and then followed by his Python program.
Good style accounts for 5% of the program grade. We are following the standard PEP 8 style guide for Python code. As part of the autograder scripts, your program is run through a static code analyser (aka a “linter”).
We are using Pylint which reports warnings and errors, including message codes, and then scores the code on a scale from 0 to 10. We multiply your percentage score by 2 (5% of the total) to determine the style grade. For example, if pylint scores your program 9, your style grade is (9/10) * 2 = 1.8.
See the Pylint website for tutorials, FAQ’s and standard warnings.
PEP 8 specifies that variable names should be at least 3 characters long, but it is long standing convention that DataFrames are named df. For the autograders, we have included df in the “good-names” that are accepted. This can be done locally with .pylintrc files or using the command-line option
pylint --good-names=df.Most IDE’s have linting available: for example, see pylint in PyCharm and Linting Python in VSCode.
Program 1: School Counts
Due date 26 Febuary 2026
Learning Objective: Refresh students’ knowledge of dictionaries and string functions of core Python, use constant models, and build competency with open source data portals.
Available Libraries: Core Python 3.6+ only.
Data Sources: NYC Open Data:
Sample Datasets:
2021
_DOE _High _School _Directory _SI .csv (Staten Island schools) 2020
_DOE _High _School _Directory _late _start .csv (schools with 9am start times in 2020)
NYC OpenData
Much of NYC agency data is publicly available at NYC Open Data. We will focus on high schools maintained by the Department of Education.
The raw data for 2021 is available at:
Since it is quite large (1.7MB), let’s filter the data set to just be high schools in Staten Island:
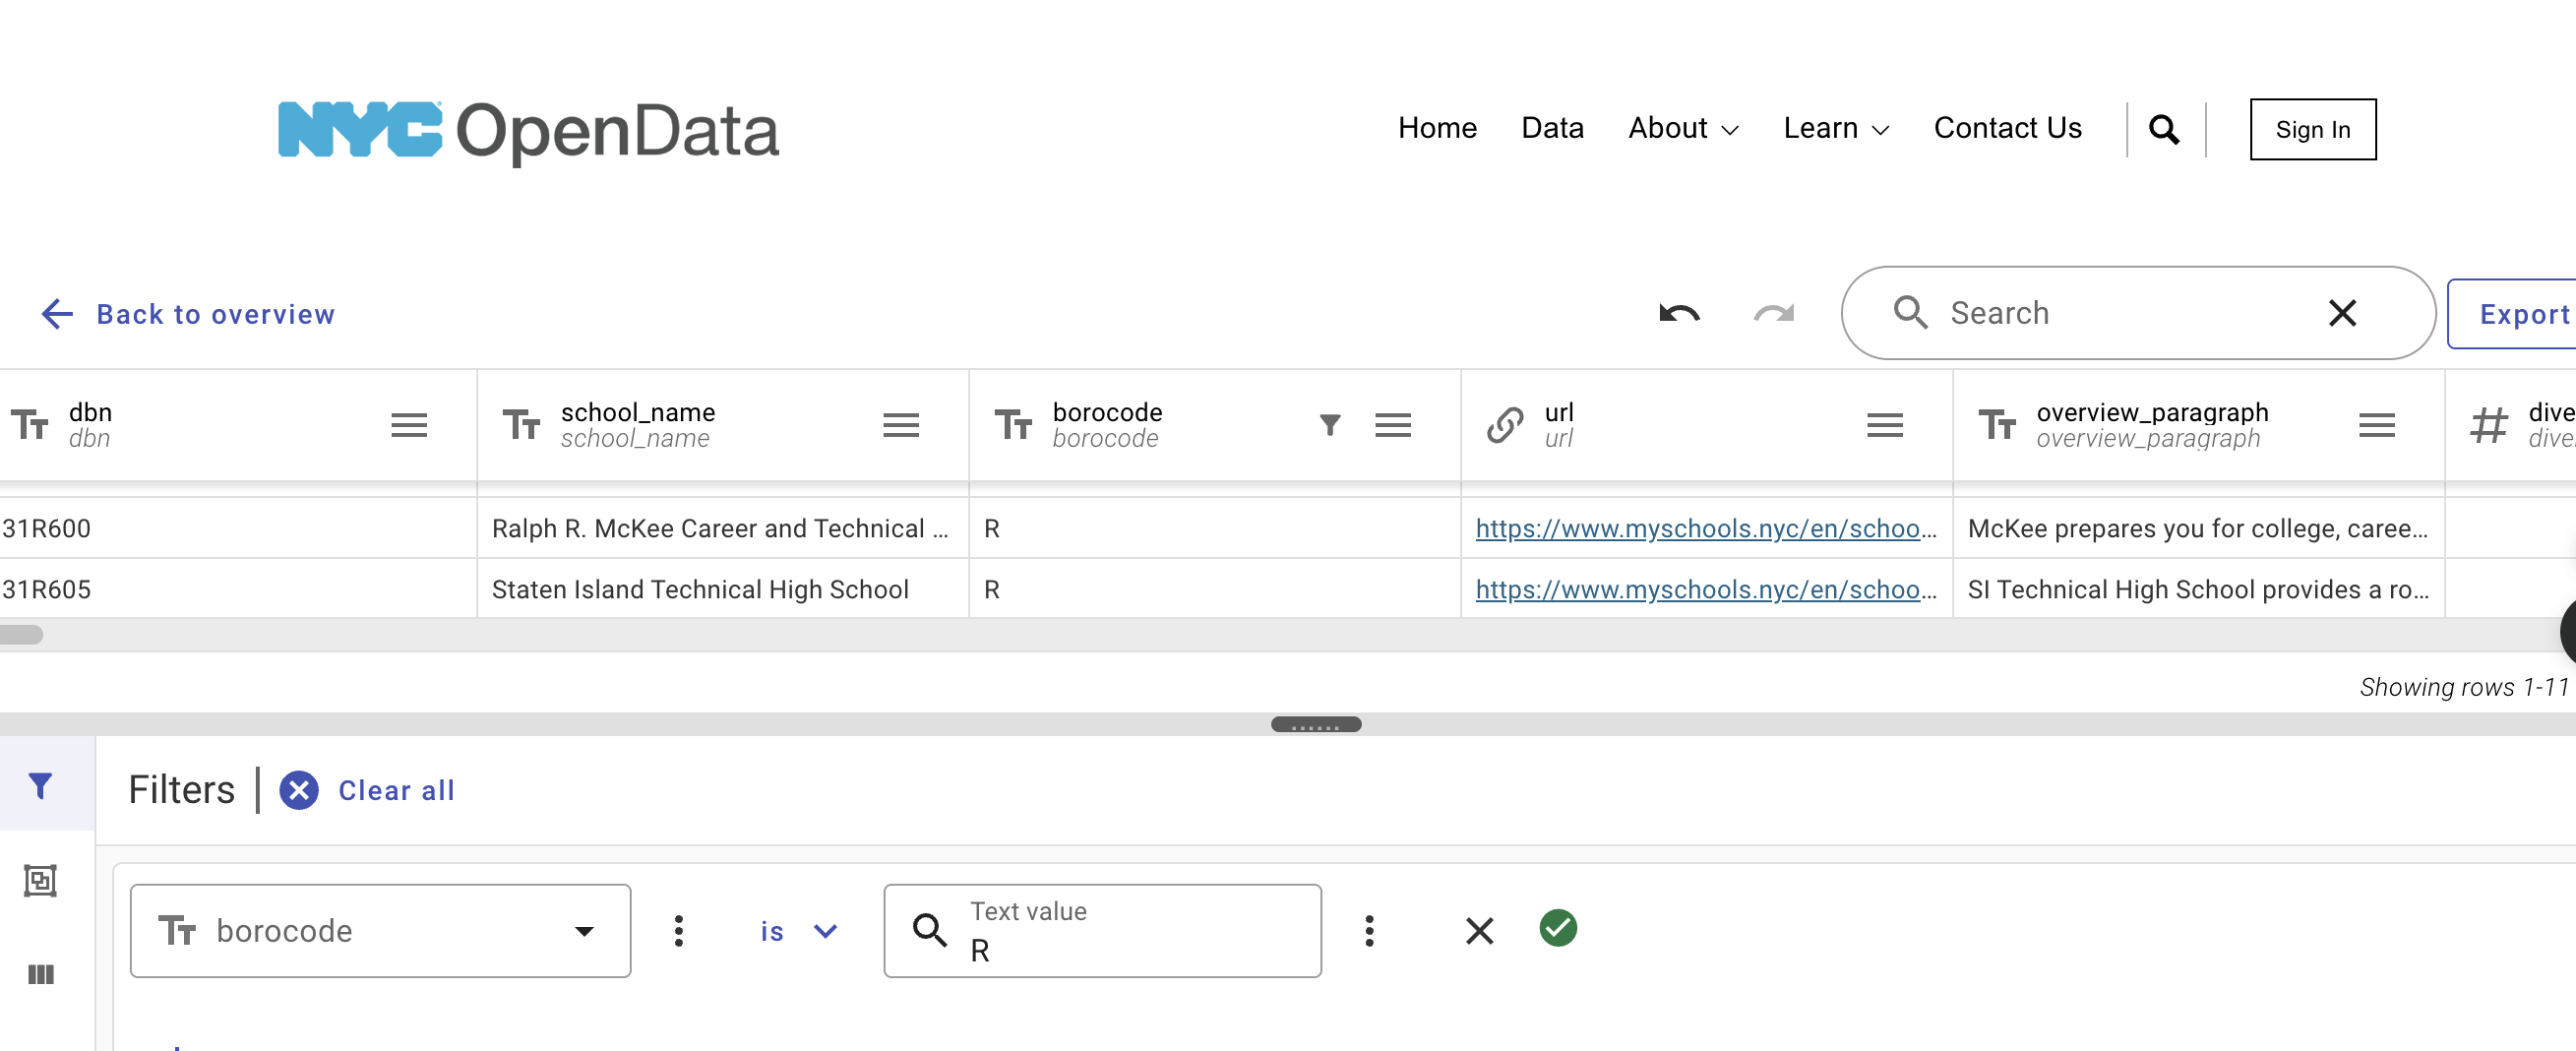
Click on the OpenData link above. Click on the
Actionsbutton. From the dropdown, chooseQuery data.In the
Filterregion (either at the bottom of the page or on the right-hand side, depending on your browser window size), chooseSelect a column to filterand chooseborocode.Change the
is one oftois.In the search box, put
R(for Richmond County or Staten Island).Click the
Applybutton. It will take a few seconds (it’s a large file) but the rows filtered will be all the Staten Island high schools.To download the file:
Click on the
Exportbutton.Under
Download, chooseCSV.The download will begin automatically (files are usually stored in the
Downloadsfolder).
Move your CSV file to the directory where you save your programs.
In addition to the Staten Island data set, create several other datasets for testing locally and to practice using the filtering on NYC OpenData.
Most of the data at NYC OpenData is stored in comma-separated-values or CSV format. The first row is usually the column names for the data, separated by commas. Each entry is in its own row, separated by commas. For example, the first 5 rows of entire 2021 dataset are:
dbn,school_name,borocode,url,overview_paragraph,diversity_in_admissions,diadetails,
school_10th_seats,academicopportunities1,academicopportunities2,academicopportunities3,
academicopportunities4,academicopportunities5,academicopportunities6,ell_programs,
language_classes,advancedplacement_courses,diplomaendorsements,neighborhood,shared_space,
campus_name,building_code,location,phone_number,fax_number,school_email,website,
recruitment_website,sqr_website,subway,bus,gradespan,finalgrades,total_students,
freshmanschedule,start_time,end_time,addtl_info1,extracurricular_activities,
psal_sports_boys,psal_sports_girls,psal_sports_coed,school_sports,graduation_rate,
pct_stu_safe,attendance_rate,pct_stu_enough_variety,college_career_rate,girls,boys,pbat,
international,specialized,transfer,ptech,earlycollege,school_accessibility_description,
program1,program2,program3,program4,program5,...
For this assignment, we are going to focus on the overview_paragraph column that contains a short description of each school.
Cleaning Data
Note: for this assignment, we are not using Pandas. We will recap Pandas in Lecture 2 and use it in the next assignment, Program 2. Instead, we’re going to use the built-in file and string I/O in Python. If you’re rusty on Python, see the chapters in the CSci 127 textbook: DS 100: Section 13.1 (String Methods) and Think CS: Chapter 11 (Files).
Programming assignments are submitted as a single .py file. If you use multiple files or notebooks, convert your program to a single .py file to submit to the autograder. For this first program, we have set up a template (see p1_template.py and also included at the end of this page). Edit the template to include your name, email, and resources and submit to Gradescope to make sure everything works.
Once you have downloaded some test data sets to your device, the next thing to do is format the data to be usable for analysis. Add the following function to your file:
extract_overviews(file_name): Opens thefile_nameand from each line of the file, keeps the overview description of the school (the fifth “column”:overview_paragraph). Returns a list of the overviews.
For example, starting with the Staten Island data set (and using the textwrap package to print prettily):
file_name = '2021_DOE_High_School_Directory_SI.csv'
si_overviews = extract_overviews(file_name)
print(f"Number of SI overviews: {len(si_overviews)}. The the last one is:\n")
print(textwrap.fill(si_overviews[-1],80))
gives the output:
Number of SI overviews: 11. The the last one is:

SI Technical High School provides a robust liberal arts curriculum including
courses in science, technology, engineering, arts, and mathematics (STEAM) and a
cutting edge Career and Technical Education (CTE) program. All students take an
Intensive Writing course and English and Language Arts curriculum to prepare
them for Advanced Placement (AP) Language and AP Literature and Composition.
Students take four years of mathematics, a variety of STEM and AP courses,
graduate with at least two or three AP Social Studies courses, and take three
years of the Russian language with an optional fourth year of a second language
via a blended learning program. All ninth grade students receive a computer to
use in school and to take home.
Running the fuction on the late start data set (schools that start 9am or later):
late_name = '2020_DOE_High_School_Directory_late_start.csv'
late_overviews = extract_overviews(late_name)
print(f"\n\nNumber of late start overviews: {len(late_overviews)}. The the last one is:\n")
print(textwrap.fill(late_overviews[-1],80))
gives the output:
Number of late start overviews: 30. The the last one is:

The mission of the Bronx International High School is to empower our students to
become active participants in today's interdependent and diverse world. We
accomplish this by helping enhance our students' cultural awareness, English and
native language proficiencies, and intellectual and collaborative abilities. We
are dedicated to serving the academic and social needs of recently immigrated
young people and their families. By critically analyzing and responding to
complex world issues, students achieve academic, personal, and professional
success as they become advocates for themselves and their communities.
Once you have written your function, test it locally on the small test files. When it works, upload to Gradescope. Given the size of the files that we evaluate your code, you will find it much faster to develop and test the code in your IDE than debugging and testing in Gradescope.
Constant Model
The first model that we will use is the constant model which predicts the same (constant) values for all inputs. We saw examples in Lecture 1 and Chapter 4 with modeling restaurant tips and bus lateness. We are going to build two models: one that predicts the length of the overview paragraphs (in number of characters) and a second that predicts the number of sentences (using the number of periods as a proxy for the number of sentences). To do that, we will use some of our datasets to compute values and determine a good constant for each one. Since the datasets can be quite large, instead of storing the numeric values in a list, we will use a dictionary that keeps count of each time a value is seen (if you’re rusty on dictionaries, see Think CS: Chapter 12 or Learning Python 3 from Scratch).
Implement the functions below. In the real world, you would likely combine these into one function, but we are implementing them separately to make partial credit and testing easier:
count_lengths(overview_list): For each element of theoverview_list, the function computes the length (the number of characters in the string). The results are stored in a dictionary of length occurrences where the keys are the lengths seen inoverview_listand the values are the number of times each length occurs. Returns the dictionary of length occurrences.count_num_sentences(overview_list): For each element of theoverview_list, the function computes the number of periods (.) (as a proxy for the number of sentences). The results are stored in a dictionary of occurrences where the keys are the number of periods seen inoverview_listand the values are the number of times each occurs. Returns the dictionary of occurrences.compute_mean(counts): Computes the mean (average) ofcountsdictionary weighting each key that occurs by its value (e.g. if the key of 10 has value 8, then the 10 showed up 8 times and adds 10*8 to the computation of the average). Returns the mean.
Continuing our example for the 11 Staten Island high schools:
si_len_counts = count_lengths(si_overviews)
print(f"The {sum(si_len_counts.values())} entries have lengths:")
print(si_len_counts)
The 11 entries have lengths:
{729: 1, 738: 1, 681: 1, 435: 1, 536: 1, 732: 2, 741: 1, 623: 1, 564: 1, 735: 1}Note that two entries have the same length.
Continuing our late start high school example:
late_len_counts = count_lengths(late_overviews)
print(f"The {sum(late_len_counts.values())} entries have lengths:")
print(late_len_counts)
gives the output:
The 30 entries have lengths:
{38: 1, 634: 1, 528: 1, 743: 1, 748: 1, 385: 1, 753: 1, 27: 1, 684: 1, 512: 1, 680: 1, 477: 1, 722: 1, 741: 1, 106: 1, 739: 1, 732: 1, 700: 1, 750: 1, 551: 1, 733: 1, 399: 1, 22: 1, 679: 1, 723: 1, 31: 1, 73: 1, 710: 1, 655: 1, 616: 1}
We can similarly compute the number of sentences:
si_dots_counts = count_sentences(si_overviews)
print(f"The {sum(si_dots_counts.values())} entries have lengths:")
print(si_dots_counts)
late_dots_counts = count_sentences(late_overviews)
print(f"The {sum(late_dots_counts.values())} entries have lengths:")
print(late_dots_counts)
gives the output:
The 11 entries have lengths:
{4: 6, 7: 2, 3: 2, 5: 1}
The 30 entries have lengths:
{0: 5, 7: 2, 3: 3, 4: 11, 5: 3, 2: 1, 6: 5}
For these small examples, the overall lengths of the paragraphs were different, but the number of sentences were much more concentrated.
We can compute the means as well:
si_len_mean = compute_mean(si_len_counts)
si_dots_mean = compute_mean(si_dots_counts)
print(f"Staten Island high schools overviews had an average of {si_len_mean:.2f} \
characters in {si_dots_mean:.2f} sentences.")
gives the output:
Staten Island high schools overviews had an average of 658.73 characters in 4.45 sentences.Evaluating Our Model
The next part of program evaluates how well our constant models do at prediction. We will use a loss function, mean squared error, introduced in Lecture 1 and Section 4.2.
compute_mse(theta, counts): This function takes two inputs:theta: a numeric value.counts: a dictionary where the keys are numerical and the values are the number of occurrences.
Computes the Mean Squared Error of the parameter
thetaand a dictionary,counts. See Section 4.2: Modeling Loss Functions where this function is implemented usingnumpyand assumes the values are in a list or Series. Note:numpyis not one of the libraries for this assignment and your function should compute MSE without using numpy. Returns the MSE.
Continuing our example of number of sentences in an overview:
late_dots_mean = compute_mean(late_dots_counts)
print(f"The mean for number of sentences in SI descriptions is {late_dots_mean}.")
losses = []
for theta in range(10):
    loss = compute_mse(theta, late_dots_counts)
    print(f"For theta = {theta}, MSE loss is {loss:.2f}.")
    losses.append(loss)
gives the output:
The mean for number of sentences in SI descriptions is 3.8.
For theta = 0, MSE loss is 18.67.
For theta = 1, MSE loss is 12.07.
For theta = 2, MSE loss is 7.47.
For theta = 3, MSE loss is 4.87.
For theta = 4, MSE loss is 4.27.
For theta = 5, MSE loss is 5.67.
For theta = 6, MSE loss is 9.07.
For theta = 7, MSE loss is 14.47.
For theta = 8, MSE loss is 21.87.
For theta = 9, MSE loss is 31.27.
The smallest losses are near the mean of 3.8. We can also visualize the lengths (as a histogram in blue) and the loss function in terms of theta (in red) using matplotlib:
import matplotlib.pyplot as plt
import seaborn as sns
plt.bar(late_dots_counts.keys(),late_dots_counts.values())
plt.plot(losses, color='r')
plt.title('Sentences in late overviews')
plt.show()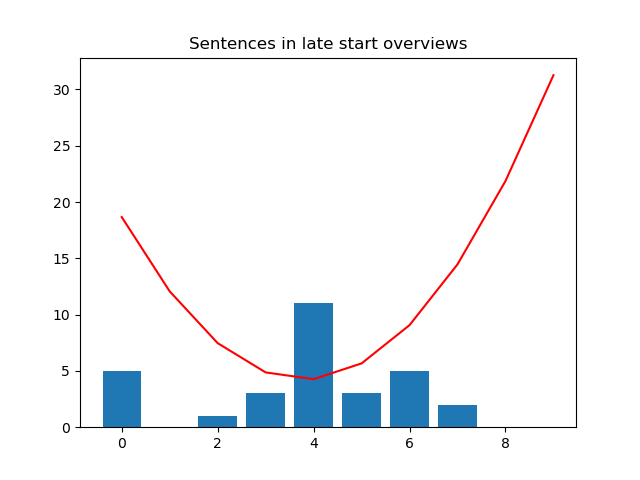
This suggests that the best constant model for sentence length is 3.8. Let’s look at the Staten Island data (generated similarly to above) which has mean 4.45:
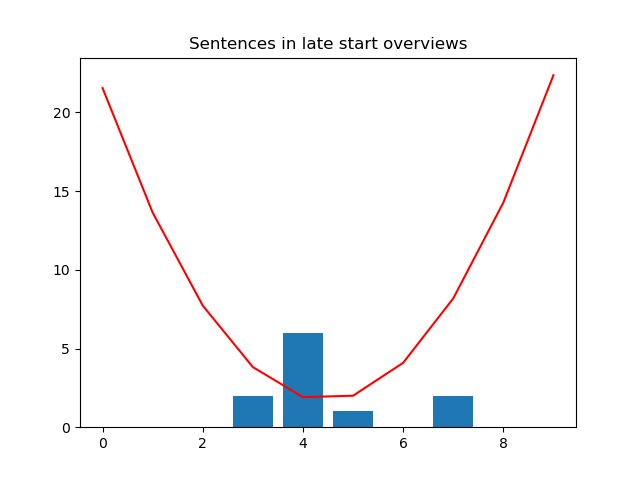
Looking at the graph of the loss function (red line), it’s minimized closer to 4.5 than 3.8. So, our constant model built on late-starting schools does not do as well for predicting sentences in SI descriptions. We will see in later lectures that the MSE loss function is minimized for the mean value (and that other loss functions achieve their minimum values at different values).
Testing Code
Each programming assignment includes functions that test that your code works (a “test suite”). We will first build these in core Python, and in future assignments (Programs 3-6), will introduce standard testing packages.
Your program should include the functions below that test if your functions above perform correctly. Each of these functions takes a function as an argument. You can write them in any order, but we have placed them easiest to hardest below:
test_compute_mean(mean_fnc=compute_mean):This test function takes one input:
mean_fnc: a function that takes one input parameter (a dictionary of counts) and returns a numeric value. It has a default value ofcompute_mean.
Returns
Trueif the function performs correctly (computes the mean) andFalseotherwise.Hint: we will test your function with three different functions: the correct one, one that returns the mean of the keys (i.e., doesn’t use the counts when computing the mean), and one that always returns 42.
test_mse(loss_fnc=compute_mse):This test function takes one input:
mse_fnc: a function that takes in two input parameters (a numeric value and a dictionary of counts) and returns a numeric value. It has a default value ofcompute_mse.
Returns
Trueif the function performs correctly (computes mean squared error) andFalseotherwise.Hint: we will test your function with three different functions: the correct one, one that returns the mean squared error of the keys (doesn’t use the counts), and one that always returns 42.
test_count_lengths(count_fnc=count_lengths):This test function takes one input:
count_fnc: a function that takes one input parameter (a list of strings) and returns a dictionary. It has a default value ofcount_lengths.
Returns
Trueif the function performs correctly (creates a dictionary of counts of occurrences of lengths) andFalseotherwise.Hint: we will test your function with three different functions: the correct one, one that returns the number of strings in the list, and one that always returns a dictionary with the key:value pair 42:42.
Trying first on the correct function:
print(f'test_compute_mean(compute_mean) returns {test_compute_mean(compute_mean)}.')gives the output:
test_compute_mean(compute_mean) returns True.
Continuing our example:
print(f'test_compute_mean( lambda x : 42 ) returns {test_compute_mean(lambda x : 42)}.')gives the output:
test_compute_mean( lambda x : 42 ) returns False.
The lambda in Python allows you to write small anonymous functions (see Python Docs 4.8.6 Lambda Expressions for more details).
Program Template
For this first program, we have included a template, p1_template.py to use to get started. It includes function stubs and some testing in a (conditionally executed) main function:
"""
  Name: YOUR NAME HERE (as it appears in Gradescope)
  Email: YOUR EMAIL HERE (as it appears in Gradescope)
  Resources:  ANY RESOURCES YOU USED
"""
import textwrap

def extract_overviews(file_name):
  """
  Opens the file_name and from each line of the file, keeps the overview
  description of the school (the fifth "column": overview_paragraph.
  Returns a list of the paragraphs.
  """

  #Placeholder-- replace with your code
  lst = []
  return lst

def count_lengths(overview_list):
  """
  For each element of the overview_list, computes the length (# of characters).
  Returns the dictionary of length occurrences.
  """

  #Placeholder-- replace with your code
  counts = {}
  return counts

def count_sentences(overview_list):
  """
  For each element of the overview_list, computes the number of periods
  (as a proxy for the number of sentences).
  Returns the dictionary of occurrences.
  """

  #Placeholder-- replace with your code
  counts = {}
  return counts


def compute_mean(counts):
  """
  Computes the mean of counts dictionary, weighting each key that occurs by its value.
  Returns the mean.
  """

  #Placeholder-- replace with your code
  mean = 0
  return mean


def compute_mse(theta, counts):
  """
  Computes the Mean Squared Error of the parameter theta and a dictionary, counts.
  Returns the MSE.
  """

  #Placeholder-- replace with your code
  mse = 0

  return mse

def test_compute_mean(mean_fnc=compute_mean):
  """
  Returns True if the mean_fnc performs correctly
  (e.g. computes weighted mean of inputted dictionary) and False otherwise.
  """

  #Placeholder-- replace with your code
  correct = True
  return correct


def test_mse(mse_fnc=compute_mse):
  """
  Returns True if the extract_fnc performs correctly
  (e.g. computes mean squared error) and False otherwise.
  """

  #Placeholder-- replace with your code
  correct = True
  return correct

def test_count_lengths(counts_fnc=count_lengths):
  """
  Returns True if the counts_fnc performs correctly
  (e.g. counts lengths of overviews and stores in dictionary) & False otherwise.
  """

  #Placeholder-- replace with your code

  correct = True
  return correct


def main():
  """
  Some examples of the functions in use:
  """

  ###Extracts the overviews from the data files:
  file_name = 'fall23/program01/2021_DOE_High_School_Directory_SI.csv'
  si_overviews = extract_overviews(file_name)
  print(f"Number of SI overviews: {len(si_overviews)}. The the last one is:\n")
  #Using textwrap for prettier printing:
  print(textwrap.fill(si_overviews[-1],80))

  late_name = 'fall23/program01/2020_DOE_High_School_Directory_late_start.csv'
  late_overviews = extract_overviews(late_name)
  print(f"\n\nNumber of late start overviews: {len(late_overviews)}. The the last one is:\n")
  print(textwrap.fill(late_overviews[-1],80))

  ###Computing counts and means:
  si_len_counts = count_lengths(si_overviews)
  print(f"The {sum(si_len_counts.values())} entries have lengths:")
  print(si_len_counts)
  late_len_counts = count_lengths(late_overviews)
  print(f"The {sum(late_len_counts.values())} entries have lengths:")
  print(late_len_counts)

  si_dots_counts = count_sentences(si_overviews)
  print(f"The {sum(si_dots_counts.values())} entries have lengths:")
  print(si_dots_counts)
  late_dots_counts = count_sentences(late_overviews)
  print(f"The {sum(late_dots_counts.values())} entries have lengths:")
  print(late_dots_counts)

  si_len_mean = compute_mean(si_len_counts)
  si_dots_mean = compute_mean(si_dots_counts)
  print(f"Staten Island high schools overviews had an average of {si_len_mean:.2f}\
characters in {si_dots_mean:.2f} sentences.")

  ###Computing MSE:
  late_dots_mean = compute_mean(late_dots_counts)
  print(f"The mean for number of sentences in SI descriptions is {late_dots_mean}.")
  losses = []
  for theta in range(10):
      loss = compute_mse(theta,late_dots_counts)
      print(f"For theta = {theta}, MSE loss is {loss:.2f}.")
      losses.append(loss)

  losses = []
  for theta in range(10):
      loss = compute_mse(theta,si_dots_counts)
      print(f"For theta = {theta}, MSE loss is {loss:.2f}.")
      losses.append(loss)

  ###Testing
  #Trying first on the correct function:
  print(f'test_compute_mean(compute_mean) returns {test_compute_mean(compute_mean)}.')
  #Trying on a function that returns 42 no matter what the output:
  print(f'test_compute_mean( lambda x : 42 ) returns {test_compute_mean(lambda x : 42)}.')

if __name__ == "__main__":
  main()